Live dashboard — gw watch
gw watch is greasewood's live, in-terminal view of the mesh: the roster of
every node with its roles and credential expiry, the live WireGuard link state
and per-second throughput, an async latency column that fills in as pings
return, and a one-line firewall summary — all redrawing in place.
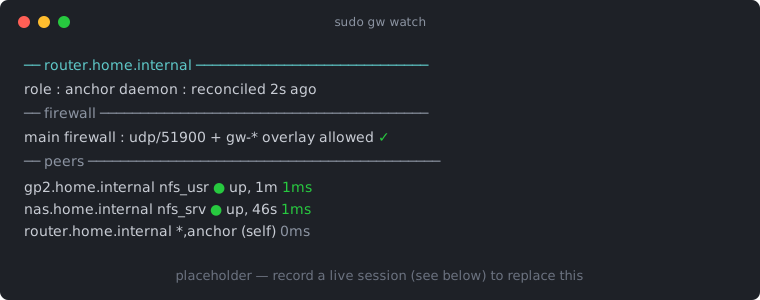
(the image above is a static placeholder — record a live session to replace it)
What you're looking at
Bare sudo gw in a terminal opens this view. Its layout, top to bottom:
- A node header — this box's identity, credential expiry, trust, and daemon freshness.
- A firewall summary — one line by default (press
f, or--firewall, for the full host-rule check and greasewood's own nftables table). The host- firewall verdict stays verbatim, so a blocked port is as loud collapsed as expanded. - The peer roster — the fleet on the left (name, address, roles, expiry),
this node's view on the right (link state, rate, latency). Colored:
●green for a live link, latency heat (green fast, yellow slow), loud red forEXPIRED/BLOCKED.
Keys
| Key | Action |
|---|---|
↑↓ / j k |
move the selection cursor |
PgUp/PgDn g G |
jump |
enter |
open the selected peer's detail panel |
f |
expand/collapse the firewall area |
t |
per-second rate ↔ cumulative traffic |
a |
show/hide expired peers (shown by default on the anchor, where they're revocable; hidden on plain nodes) |
r |
(anchor, in panel) edit a peer's roles |
x |
(anchor, in panel) revoke a peer |
? |
in-view help (keys + the everyday commands) |
q |
close a panel / quit |
On the anchor, selecting a peer and pressing r opens a role editor that
writes the declarative [assign] table and previews the
tunnel delta before applying; x opens a revoke flow gated by typing the
peer's hostname. On any node the panel is read-only.
For piping or logging, gw watch --snapshot prints a single static view (no
root, no terminal needed) with an everyday-commands index below it.
Recording the demo
The recording above is best captured on a real mesh — the colors, latency, and firewall summary are only meaningful with live nodes. On an anchor or node:
# 1. record a ~20s session (Ctrl-D or `exit` to stop)
asciinema rec gw-watch.cast --command "sudo gw watch" --idle-time-limit 2

# 2. convert to a GIF (agg = asciinema gif generator)
agg --theme monokai --font-size 16 gw-watch.cast gw-watch.gif

# 3. drop it in
cp gw-watch.gif docs/assets/gw-watch.gif
Prefer a crisper, smaller, text-selectable asset? svg-term renders the same
.cast to an animated SVG (svg-term --in gw-watch.cast --out
docs/assets/gw-watch.svg); point the image above at the .svg instead.